Lesson 6 - Color, Texture, Layer Effects, Preset Manager
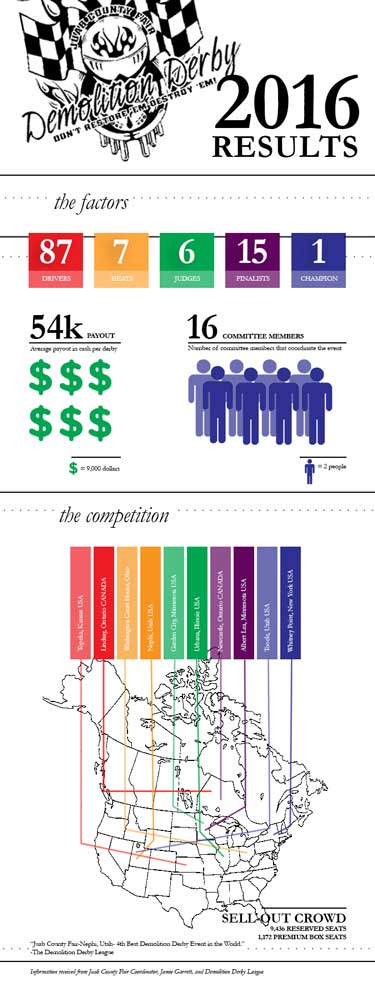
Using real data, I wanted to create a compelling infographic making the amount of information easier to comprehend. Being from a small town, we are involved in all community events. Recently, the Juab County Fair Demolition Derby was announced as the fourth best demolition derby event in the world. This is quite the accomplishment so I contacted the coordinator and they released the information in regards to the derby.
Photoshop Skills Used:
Design Thoughts:
Resources:
Image Source: World Map
Logo Source: Jamie Garrett, Juab County Fair Coordinator
Photoshop Skills Used:
- Layer Tool
- Rectangle Tool
- Quick Selection Tool
- Image Adjustment > Threshold
- Text Tool
- Brush Tool
- Ruler
- Grids
Design Thoughts:
- Sketched out the design using old school pencil and paper
- Considering most infographics are vertical; I started with a canvas size of 600 px wide and 2000 px tall
- Filled the layer background, white to make the graphics and text standout; concept of contrast
- Created subsections based on the information received (categorized) using different sized text and color variations
- Used the rectangle tool to create boxes to appear like flag and top 10 Demolition Derby locations based on state/area; changing opacity to emphasize text
- Quick selection tool was used on the outline of dollar sign and people; then filled with color and copied to create multiple copies
- Text tool used for text and numbers (Garamond font used- bold and italic), size varied on position
- Juab County Demolition Derby logo adjusted using Threshold to remove the color
- Brush tool used to create separation of ideas and decorative lines (dotted lines) at 3px, hard brush
- Ruler/grids used to create alignment and cohesive layout
Resources:
Image Source: World Map
Logo Source: Jamie Garrett, Juab County Fair Coordinator
